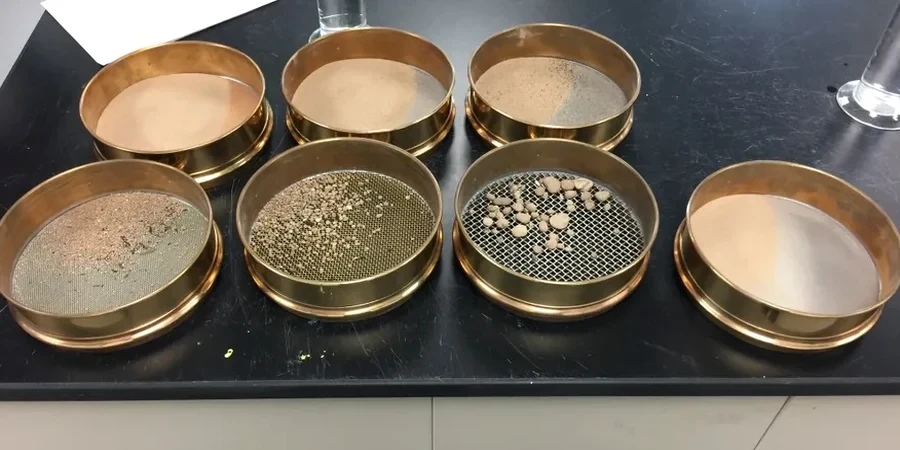
The stacked brass sieves on the mechanical shaker tell you a lot about a Wollongong soil before a single hydrometer reading is taken. From the coarse fraction retained on the 75-micron sieve to the fine silt and clay that stays in suspension for hours, every mass increment shapes the engineering classification. The laboratory team runs the full combined method under AS 1726: washed sieving for the sand and gravel portion, followed by a hydrometer sedimentation analysis using sodium hexametaphosphate as the dispersing agent. The goal is a continuous particle-size distribution curve that reveals the D10, D30, and D60 values. In a coastal city built on Quaternary alluvium and residual profiles derived from the Illawarra escarpment sandstones, those three numbers define the drainage and compaction response of the material before it ever touches a compactor.
In Wollongong a single hydrometer curve can distinguish a free-draining structural fill from a moisture-sensitive material that will fail under compaction.
How we work
The coastal bench on which Wollongong sits presents a stark contrast between beach-derived quartz sands and deeply weathered Permian siltstones. This geological duality makes grain size analysis indispensable because a material that looks uniform in the field often plots as a gap-graded or widely graded soil once the hydrometer data is added. The hydrometer test runs over a 24-hour period with readings at 0.5, 1, 2, 4, 8, 15, 30, 60, 120, 240, and 1440 minutes, corrected for temperature and meniscus rise. The combined curve then feeds directly into the Unified Soil Classification System and AS 4678 granular filter design criteria. For projects where fill compaction is specified, the
field density testing with sand cone provides the companion QA data, but the lab particle distribution sets the compaction target beforehand.
Quick answers
What is the difference between a sieve analysis and a full combined grain size test?
A sieve analysis alone covers the coarse fraction down to 75 microns using a stack of sieves on a mechanical shaker, and it is sufficient for clean sands and gravels. The combined test adds a hydrometer sedimentation analysis for the material passing the 75-micron sieve, measuring silt and clay fractions based on Stokes' law. In Wollongong's residual soils, skipping the hydrometer often means missing a significant clay fraction that controls the soil's engineering behaviour.
How much does a grain size analysis with hydrometer cost in Wollongong?
A combined sieve and hydrometer test in Wollongong typically runs between AU$170 and AU$270 per sample, depending on the number of sieves requested and whether the sample requires pre-treatment for organic content or aggregation. The price includes the full particle-size distribution curve, the USCS classification, and the Cu and Cc coefficients.
Why does AS 1726 require the hydrometer test for soils with more than 12 percent fines?
AS 1726 sets the threshold because once the fine fraction exceeds roughly 12 percent, the soil's permeability, compressibility, and shear strength become controlled by the silt and clay content rather than the sand skeleton. The hydrometer quantifies the relative proportions of silt and clay, which determines whether the material classifies as a silt (ML) or a clay (CL/CH) under the Unified Soil Classification System, a distinction that changes the allowable bearing pressure and the earthworks specification.
Can grain size data predict soil permeability for drainage design?
For granular soils with less than 5 percent fines, the D10 particle size from the grain size curve can provide an estimated permeability coefficient using Hazen's empirical correlation. In Wollongong's coastal sands this estimate is often within one order of magnitude of a measured permeability test. For soils with higher fines content the correlation breaks down, and an in-situ permeability test becomes the more reliable method for drainage design.